
📋 Logs
What you can do on this screen
Section titled “What you can do on this screen”The Logs screen is where you inspect individual DNS queries handled by Pi-hole. You mainly use it to:
- Find a specific query by domain, time, or client
- Confirm whether a request was allowed or blocked
- Add a domain to the Allowlist or Blocklist directly from a log entry
This screen is your primary tool when troubleshooting broken apps, websites, or unexpected blocking behavior.
Start by narrowing down what you are looking for
Section titled “Start by narrowing down what you are looking for”Logs can grow quickly, so the first step is usually to reduce the list.
At the top of the screen, you have controls for search, filtering, sorting, and live updates. These tools work together, but not all of them should be used at the same time.
Monitor activity in real time
Section titled “Monitor activity in real time”Live mode lets you watch DNS queries as they happen. Use it when reproducing an issue and confirming which domains are queried in real time.
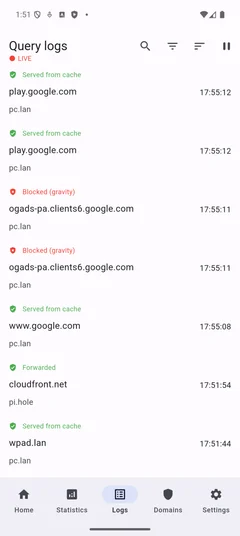
Left: Live mode ON Live updates are active. A ● LIVE label appears under the screen title, clearly indicating that new log entries are being added automatically. The icon on the right changes to a pause symbol. Tap it to pause live updates.
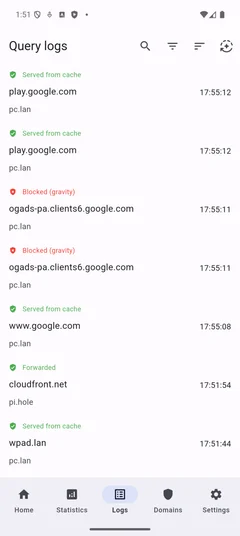
Center: Live mode OFF (paused) Live updates are currently stopped. The icon on the right changes to a resume-style symbol. Tap it to resume live updates and return to real-time monitoring. By default, Live Log is enabled, but live updates start paused until you tap resume.
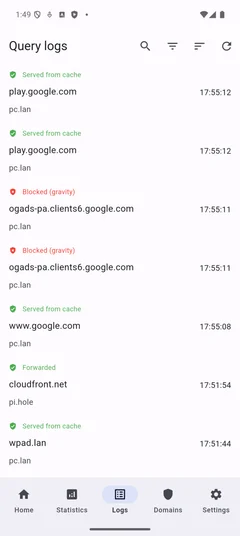
Right: Live mode disabled Live mode is currently disabled by app settings. This is a manual choice in App Settings.
When disabled, the icon on the right changes to a manual refresh button. Tap this button to fetch the latest logs once, without enabling continuous live updates.
You can re-enable Live mode from: Settings → App Settings → Advanced Settings → Live Log
After enabling it there, return to Logs to use real-time monitoring.
Search for a domain or keyword
Section titled “Search for a domain or keyword”Tap the search icon to open the search field. As soon as you start typing, the log list narrows down to matching entries.
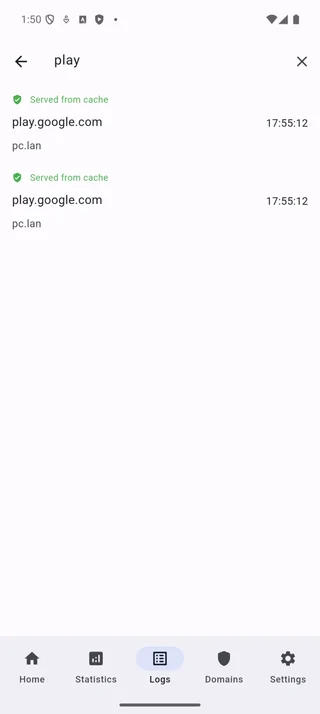
Use search when you know part of a domain name. Exit search using the back arrow if you want to return to the full list.
Avoid searching while the server is disconnected, as results may be incomplete.
Filter logs by time, status, or client
Section titled “Filter logs by time, status, or client”Tap the filter icon to open the filter sheet. This is the most powerful way to focus on a specific situation.
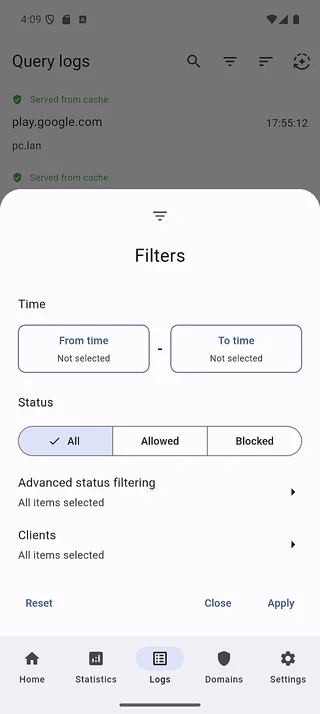
Inside the filter sheet, you can refine the log list step by step.
Limit the time range
Section titled “Limit the time range”Use the From and To fields to select a time window.
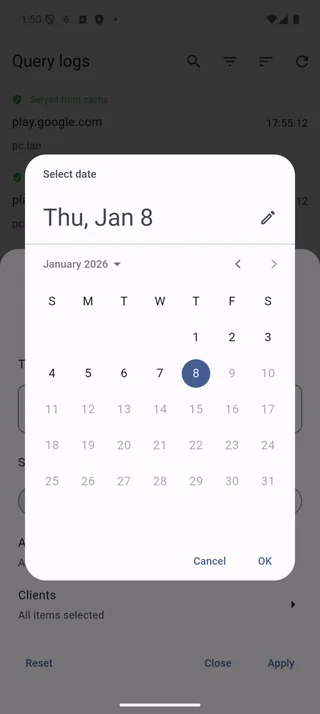
Choose a short range when investigating a recent issue. Very broad ranges can make it harder to spot relevant entries.
Filter by query status
Section titled “Filter by query status”Select one or more statuses, such as Blocked or Allowed.
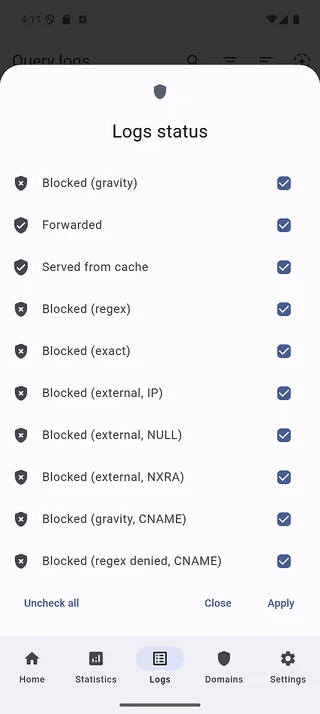
Use Blocked when checking why something failed to load. Limit the number of selected statuses to keep results readable.
Focus on a specific client
Section titled “Focus on a specific client”Select a client to show queries from a single device.
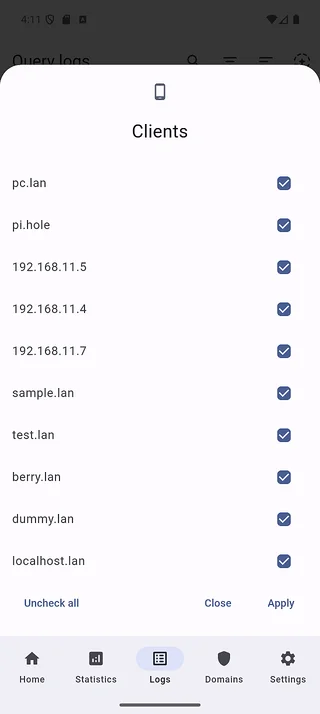
This is useful when one device behaves differently from the rest of the network. Skip client filtering if you want a complete network view.
Change the log order
Section titled “Change the log order”Tap the sort icon to switch between Latest first and Oldest first.
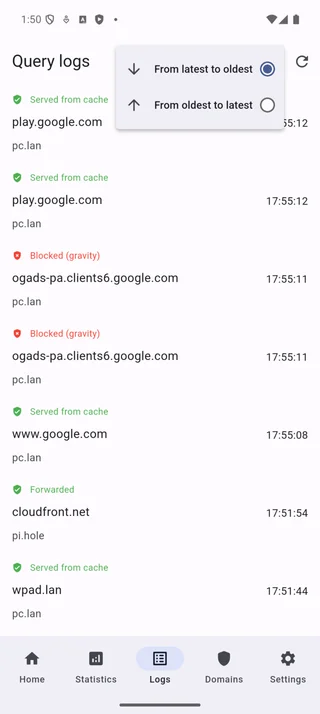
Use Latest first when monitoring ongoing activity. Switch to Oldest first when reviewing past events in order.
The list order updates immediately when you change the sort option.
Inspect a log entry and take action
Section titled “Inspect a log entry and take action”Once you find a relevant entry, tap it to open the detail view.
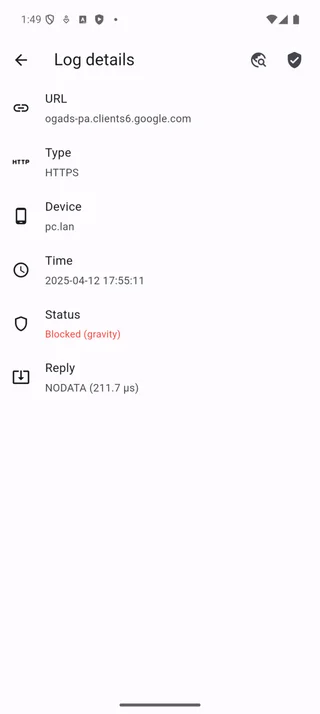
Each detail view shows the domain, client, time, and status of the query, along with actions you can take.
Add a domain to the allowlist
Section titled “Add a domain to the allowlist”Use Add to allowlist when a legitimate site or app is broken by blocking. This adds the domain to Pi-hole’s allowlist, and future queries will be permitted.
Add a domain to the blocklist
Section titled “Add a domain to the blocklist”Use Add to blocklist when you are confident the domain is unwanted.
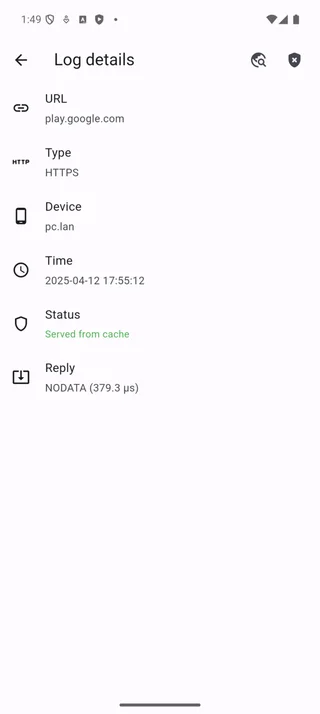
Blocking adds the domain to Pi-hole’s blocklist. Future queries will be blocked according to this rule.
Typical ways to use Logs
Section titled “Typical ways to use Logs”-
A website does not load: Open Logs, filter by Blocked, find the domain, and allowlist it if appropriate.
-
One device behaves strangely: Filter by client and inspect recent queries from that device.
-
Real-time troubleshooting: Enable live mode, reproduce the issue, and watch queries appear as they happen.
Important notes and limits
Section titled “Important notes and limits”- Logs can be limited or anonymized by Pi-hole privacy settings.
- Heavy filtering may take time on large datasets.
- Allowlist and blocklist actions affect only the currently selected server.
Pi-hole concepts used on this screen
Section titled “Pi-hole concepts used on this screen”Each log entry represents a DNS query processed by Pi-hole. The status indicates whether the query was allowed or blocked. Adding a domain to either list updates Pi-hole’s lists and affects future queries immediately.